Understanding Forex Trading Charts
Understanding Forex Trading Charts
Sir Francis Bacon, a renowned English poet, once said that “reading makes a full man.” Indeed, learning almost every skill in this world starts with reading. From writing a poem and composing music to constructing buildings and treating diseases, reading serves as a solid skill foundation.
Forex trading is no different. You can easily learn about terms and strategies related to this business through reading books and articles authored by experts. Yet, forex trading requires an even more skillful side to reading. That is, it demands that you learn how to read forex trading charts.
All about the chart
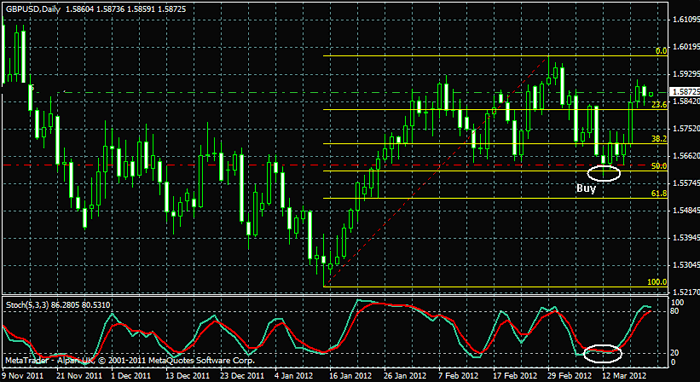
A forex trading chart is basically a chart that plots a currency pair’s price movement over a period of time. Most charts plot time from left to right on the horizontal (or X-axis) and price from bottom to top on the vertical (or Y axis). The price of the currency pair is usually represented in the form of a line, bar, box, or candlestick.
Different forex trading charts feature different time intervals. While some charts may plot time with 30-minute increments or shorter, others have daily increments. If you’re a short-term trader, it’s advisable that you use the first one. But if you consider yourself a long-term trader, you may find the charts with daily increments more useful. Then again, you may want to use a combination of both charts to have a better look at the trends.
Here are the characteristics of different forex chart types:
Candlestick chart – This is the chart type that most forex traders use. The candlesticks represent the opening, high, low, and closing prices for each trading period. While the body of the candle or its rectangular part stands for the open and close prices, the wick shows the high and low prices.
Line chart – This chart shows only one price–often the closing prices—for each period.
Bar chart – A bar chart is similar to a candlestick chart. However, most traders say that it is more difficult to read. This chart plots opening and closing prices with the use of horizontal tick marks on a vertical bar.
Reading the images and figures
Now, it’s time to know the basics of forex charts. First, you must understand how currency pairs are expressed in forex charts. When a currency pair is displayed, the currency on the left side is the base currency and the one on the right is the terms currency.
If, for example, your currency pair is USDCHF and the forex chart shows that its current price is around 1.3346, this means that it would take 1 US dollar to buy 1.3346 Swiss Francs. If the forex chart shows that the price of USDCHF declines, this means that the Swiss Franc is strengthening against the US dollar. If the opposite is displayed by the chart, then the Swiss Franc is losing value compared to the US dollar.
In candlestick charts, the very top of the candlestick is the highest price for the currency pair. The bottom of the wick is the lowest price for it. You can consider a candlestick “bullish,” or representative of a bull market, when the close of the candle is higher than the open. You’ll find that some candlesticks don’t have wicks. This means that the price of that currency pair opened and dropped off until it closed. In contrast to a “bullish” candle, a “bearish” candle has a close that is lower than the open.
Make sure you have a chart that displays the particular time frame that you need (hourly chart, 15-minute chart, or 5-minute chart). When you want a combination of these charts, it’s best to keep multiple layouts or tabs so that you can conveniently switch between charts.
You should then check the bottom of the chart. Here you will find the time zone that the forex charting software follows. Different charts follow various time zones. For this reason, you must always be ready to convert the chart’s time to your own. You’ll need to do this every time an important economic announcement happens. Once you have taken note of the time at the bottom of the chart, you must make sure this time corresponds with the time the candle opens or closes.
Now, it’s time to look for specific details in the chart. Make sure you take note of the prevailing trend in the chart, the current price in relation to the 60-period simple moving average, the high and low since GMT 00:00 and the tops and bottoms during the full 3-day time period. For trend evaluation, take note of two trends: major trend and minor trend. The latter is basically a reversal of the major trend and lasts for a short period of time.
When you find that the chart shows an upward trend, it might be a good idea to go “long.” This means buying so that you can sell your investment later when it has gained profit. When you see a downward trend in the forex chart, then you might want to go “short,” which means selling your currency pair before its value declines.
Being a better reader
Training yourself to become a better forex chart reader also means increasing your chances of earning bigger profits in the trade. One way to get better at chart-reading is to keep your chart analysis as simple as possible. This reduces the risk of confusing yourself in the analysis process.
You also make the chart-reading process less complicated by sticking to one type of chart. While you’re free to choose any type, it’s best to stick to reading candlestick charts, since this type is widely used in different forex trading software available out there.
You may also consider subscribing to a service that offers charts through the Internet. Such services usually provide assistance in reading and analyzing forex charts. As a beginning forex trader, this can be a very helpful exercise in honing yourself as a better chart reader. Lastly, practice, practice, and more practice. By frequently reading forex trading charts, analyzing them and checking if your predictions match with what happens in the market, you can easily get better in reading charts and use them for your own trade.
After learning how to read the charts
Learning the art of reading forex charts and getting better at it is not enough to be successful in this trade. In fact, it is only half-way in making a sound decision for your investments. Determining trends with the use of forex charts is actually referred to as the technical analysis in forex trading. By training yourself in fundamental analysis, you’ll be better equipped in making good decisions in your investments. This approach requires the analysis of economic and political factors to recognize or predict trends.
Better read up on the latest news about various nations, particularly the one with the currency you have your investment on. Then, just pair these readings with your skill in reading forex charts, and you’ll make a better investor out of yourself.